Multiple Choice
A professor wants to know if the amount of time her students spent working on a statistics assignment relates to the grade the student receives. She surveyed 10 students and recorded the data below. Which of the following statements is most correct? 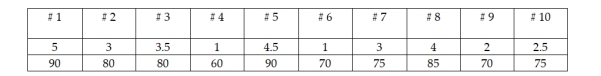
A) A histogram will illustrate whether a linear relationship exists between the number of hours studied and the grade received.
B) A scatter diagram would be useful for displaying a relationship between the number of hours studied and the grade received.
C) A line chart for these data will show a trend between the student number and the grade received.
D) None of the above
Correct Answer:

Verified
Correct Answer:
Verified
Q43: Which of the following is a false
Q44: A scatter diagram is a line graph
Q45: In constructing a histogram for a joint
Q46: When a histogram is constructed for discrete
Q47: In a report describing the number of
Q49: In situations involving two or more variables,
Q50: Explain what information can be conveyed by
Q51: When using the Histogram tool in Excel
Q52: Why should a histogram contain no gaps
Q53: A stem and leaf diagram is an