Multiple Choice
The following is a bar chart summarizing educational attainment in the US in 2017. 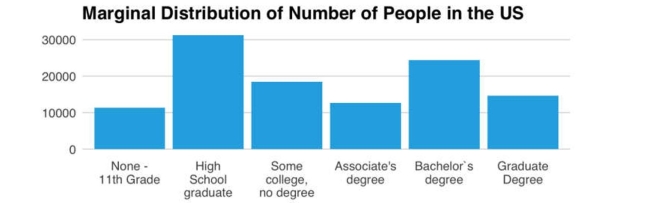 This bar chart shows
A) the marginal distribution of educational attainment.
B) the conditional distribution of educational attainment.
C) the contingency distribution of educational attainment.
D) the distribution for a quantitative variable.
E) none of the above.
Correct Answer:

Verified
Correct Answer:
Verified
Q7: A regional survey was carried out
Q8: A company interested in the health of
Q9: The US Census reported the following counts
Q10: A company interested in the health of
Q11: Accenture, a consulting firm, conducted an
Q13: A regional survey was carried out
Q14: A regional survey was carried out
Q15: The US Census reported the following counts
Q16: Based on the side-by-side bar chart summarizing
Q17: In May, 2010, the Pew Research Center