Multiple Choice
Here is a stacked bar chart for data collected about employee blood pressure. 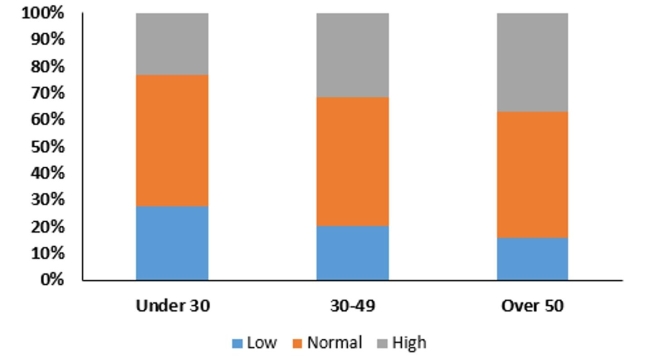 This chart shows
A) the distribution of a quantitative variable.
B) the contingency distribution of blood pressure type.
C) the conditional distribution of blood pressure type.
D) the marginal distribution of blood pressure type.
E) the joint distribution of blood pressure type.
Correct Answer:

Verified
Correct Answer:
Verified
Q1: A regional survey was carried out
Q2: A regional survey was carried out
Q3: A regional survey was carried out to
Q5: A company interested in the health of
Q6: Accenture, a consulting firm, conducted an
Q7: A regional survey was carried out
Q8: A company interested in the health of
Q9: The US Census reported the following counts
Q10: A company interested in the health of
Q11: Accenture, a consulting firm, conducted an