Multiple Choice
The following table shows total assets ($ billion) for a small sample of U.S.banks in the 4th quarter of 2018. 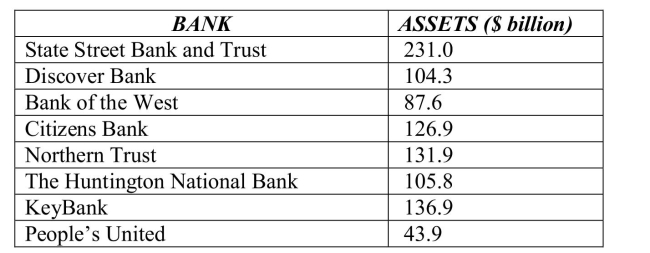 The standard deviation for these data is
A) $ 53.55 billion.
B) $ 100.35 billion.
C) $ 75.68 billion.
D) $ 84.21 billion.
E) $ 89.79 billion.
Correct Answer:

Verified
Correct Answer:
Verified
Related Questions
Q6: The following table shows representative recent
Q7: Consider the five number summary of
Q8: Consider the five number summary of
Q9: The following table shows data for total
Q10: Consider the five number summary of
Q11: Below is a histogram of salaries (in
Q12: A clothing store uses comment cards
Q14: Below is a histogram of salaries (in
Q15: Here is the five number summary
Q16: The following table shows representative recent