Multiple Choice
Solve the problem.
-The following scatter diagram shows heights (in inches) of children and their ages. 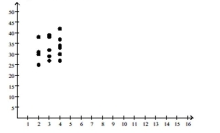
Age (years) What is the expected height range for a 2-year old child?
A) 35-45 inches
B) 40-50 inches
C) 25-38 inches
D) 20-30 inches
Correct Answer:

Verified
Correct Answer:
Verified
Related Questions
Q57: Find the vertex and axis of
Q58: Solve the problem.<br>-In a certain city, the
Q59: Solve the problem.<br>-The following data represents the
Q60: Find the zeros of the quadratic
Q61: Determine the quadratic function whose graph is
Q63: Match the graph to one of
Q64: Determine the domain and the range
Q65: Find the complex zeros of the
Q66: Determine the quadratic function whose graph
Q67: Graph the function. State whether it is