Short Answer
Use a graphing calculator to plot the data and find the quadratic function of best fit.
-The following table shows the median number of hours of leisure time that Americans had each week in
various years. 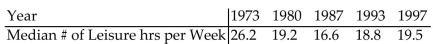
Use x = 0 to represent the year 1973. Using a graphing utility, determine the quadratic regression equation for
the data given. What year corresponds to the time when Americans had the least time to spend on leisure?
Correct Answer:

Verified
M(x) = 0.0...View Answer
Unlock this answer now
Get Access to more Verified Answers free of charge
Correct Answer:
Verified
View Answer
Unlock this answer now
Get Access to more Verified Answers free of charge
Q188: Solve the problem.<br>-The length of a vegetable
Q189: Use a graphing utility to find
Q190: Solve the problem.<br>-Suppose that the quantity supplied
Q191: Find the real zeros of the
Q192: Determine the quadratic function whose graph is
Q194: Use a graphing calculator to plot
Q195: Find the zeros of the quadratic
Q196: Determine the quadratic function whose graph is
Q197: Use a graphing calculator to plot
Q198: Solve the problem.<br>-A truck rental company rents