Short Answer
A survey examined the relationship between political party affiliation and gender. The
following cross-tabulation presents the data. 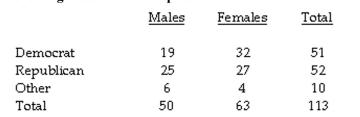
Calculate total percents for each cell.
Correct Answer:

Verified
16.81%
28...View Answer
Unlock this answer now
Get Access to more Verified Answers free of charge
Correct Answer:
Verified
16.81%
28...
28...
View Answer
Unlock this answer now
Get Access to more Verified Answers free of charge
Related Questions
Q1: A _ is a table that presents
Q2: The question below refers to the following
Q3: Skewness refers to:<br>A)a symmetrical distribution of scores.<br>B)having
Q4: A _ is the frequency of occurrence
Q5: _-level scores can be presented in a
Q7: In a cross tabulation, if the independent
Q8: The question below refers to the following
Q9: Pie charts are particularly useful for what
Q10: _ scores on one side of a
Q11: The midpoint of the class interval 90-99