Essay
The question below refers to the following data depicting the relationship between political affiliation and age range: 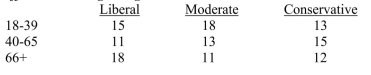
Calculate the sum frequency of agreements.
Correct Answer:

Verified
Correct Answer:
Verified
Related Questions
Q24: The contingency coefficient (C) and Cramer's V
Q25: For rs to determine the exact position
Q26: To test the null hypothesis that X
Q27: Agreements and inversions can be understood as
Q28: Perfect inversion indicates a perfect negative correlation
Q30: Requirements for using gamma and phi include
Q31: The question below refers to the following
Q32: Work Problems<br>The question below refers to the
Q33: Goodman and Kruskal's gamma (G) is used
Q34: The phi coefficient ( <img src="https://d2lvgg3v3hfg70.cloudfront.net/TB2752/.jpg" alt="The