Short Answer
The question below refers to the following data depicting the relationship between political affiliation and age range: 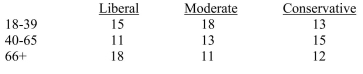
Calculate the sum frequency of inversions.
Correct Answer:

Verified
Correct Answer:
Verified
Related Questions
Q5: The question below refers to the following
Q6: In Goodman's and Kruskal's gamma (G), perfect
Q7: When nominal data are presented in a
Q8: Which test is an alternative to the
Q9: Spearman's rank-order correlation is only used for
Q11: A perfect positive correlations is expressed as
Q12: The question below refers to the following
Q13: Which of the following is NOT a
Q14: The contingency coefficient (C) is used for
Q15: The phi coefficient ( <img src="https://d2lvgg3v3hfg70.cloudfront.net/TB2752/.jpg" alt="The