Multiple Choice
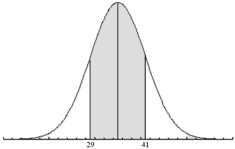
The graph below is of a normal curve. The shaded portion of the graph represents 68 % of the total area under the curve. According to the graph, what is the value of the 99.85th percentile P99.85 ?
A) 35
B) 47
C) 53
D) 59
E) None of the above.
Correct Answer:

Verified
Correct Answer:
Verified
Related Questions
Q12: An honest coin is tossed a total
Q13: In a normal distribution with a mean
Q14: After several weeks of compiling data you
Q15: A normal distribution has a mean of
Q16: A normal distribution has a mean of
Q18: The time that it takes an Olympic
Q19: The height of an 18-year old student
Q20: The time that it takes an Olympic
Q21: The actual number of hours that a
Q22: Which of the following scenarios would it