Multiple Choice
The box-plot shown below was constructed from data regarding the annual salaries of both Opera singers and Country Western singers. 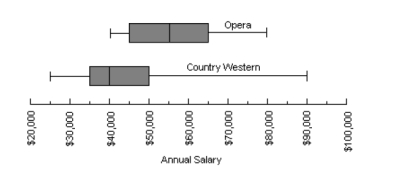 Based on the graph shown above, what is the inter-quartile range of annual salaries for Opera signers?
A) $15000
B) $20000
C) $45000
D) $66000
E) None of the above.
Correct Answer:

Verified
Correct Answer:
Verified
Related Questions
Q25: In order to qualify for the game
Q26: The data shown below represents the annual
Q27: You and several friends in your dorm
Q28: In order to qualify for the game
Q29: You and several friends in your dorm
Q31: You and several friends in your dorm
Q32: The histogram shown below gives the heights
Q33: The box-plot shown below was constructed from
Q34: The members of the golf club at
Q35: You and several friends in your dorm