Multiple Choice
The chart below shows the average travel time in minutes between five different cities. Give the total time (cost) of the tour found by applying the cheapest-link algorithm. 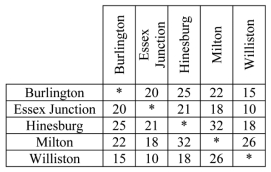
A) 81
B) 85
C) 92
D) 100
E) None of the above.
Correct Answer:

Verified
Correct Answer:
Verified
Related Questions
Q15: Consider the weighted graph given below; apply
Q16: For the weighted graph below, apply the
Q17: Which of the graphs below has a
Q18: The game Doodle-Chip consists of moving a
Q19: For the weighted graph shown below, apply
Q21: Which algorithm will always give the optimal
Q22: Is the graph given below a Complete
Q23: <img src="https://d2lvgg3v3hfg70.cloudfront.net/TB6029/.jpg" alt=" -Consider the graph
Q24: Consider the weighted graph given below; apply
Q25: The chart below shows the one-way charge