Multiple Choice
The diagram on the right shows data from a single earthquake plotted on a diagram that shows the mathematical relationship between distance, magnitude, and S-wave amplitude. What do these data show? 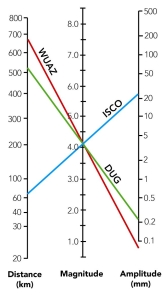
A) the distance between stations WUAZ and DUG is 680 km
B) station ISCO is 22 km from the earthquake epicenter
C) the local magnitude of the earthquake recorded by these three stations is 4.1 MI
D) station DUG was closest to the earthquake
Correct Answer:

Verified
Correct Answer:
Verified
Q10: What is illustrated by this figure? <img
Q11: The earthquake location shown as the red
Q12: Which of the following is a characteristic
Q13: On this map of South America and
Q14: What was the main cause of death
Q16: On this map of South America and
Q17: Which of the following resulted from the
Q18: Which observations would tell you the most
Q19: What features in the image help you
Q20: Which of the following are potential sources