Multiple Choice
The Modified Mercalli Intensity rating map on the right shows intensity values that range from more than X to less than III. What does this map show? 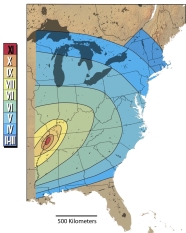
A) this earthquake had a Richter magnitude of 10 or 11 near the source
B) this earthquake had a Richter magnitude of 3 or 6 along the East Coast
C) the earthquake was not felt in southern Florida
D) shaking was felt only very near to the earthquake
E) building damage occurred in all of the zones that are shaded on this map
Correct Answer:

Verified
Correct Answer:
Verified
Q19: What features in the image help you
Q20: Which of the following are potential sources
Q21: On this map of South America and
Q22: When a seismic wave hits an interface
Q23: If an area has shallow, intermediate, and
Q25: Earthquakes, landslides, and volcanic eruptions that occur
Q26: Sudden movement on a fault can cause
Q27: The shaded areas on this map have
Q28: The continental block shown in this figure
Q29: Which of the following did NOT cause