Multiple Choice
This graph shows an interpretation of temperatures based on the change in isotopes in ice-core data. This graph implies that: 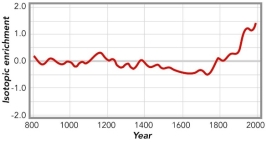
A) current temperatures are by far the hottest based on this record
B) atmospheric warming started as early as the late 1700s
C) the coolest time period on this data set was from around 1500 to the last part of the 1700s
D) all of these
Correct Answer:

Verified
Correct Answer:
Verified
Q72: This figure shows how sunlight strikes the
Q73: Which of the following is NOT a
Q74: Pictured here is a model of how
Q75: As a result of cold currents, July
Q76: To create a land breeze<br>A) the cool
Q78: Wind moves sediment by:<br>A) bouncing sand grains
Q79: This figure shows warmer-than-normal sea-surface temperatures in
Q80: Which of the following is a key
Q81: As described in the chapter opener, the
Q82: Which of the following is NOT a