Multiple Choice
Compared with curve 2 on this hydrograph, what is a possible explanation for curve 1? 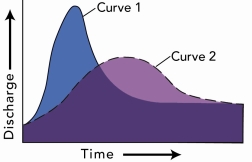
A) the basin for curve 1 has steeper slopes than the basin for curve 2
B) the storm recorded by curve 1 was shorter and more intense than the storm represented by curve 2
C) curve 1 shows the same area as curve 2 but after urbanization
D) all of these are possible
Correct Answer:

Verified
Correct Answer:
Verified
Q125: Which of the features on this aerial
Q126: Which of the lettered sites would most
Q127: Use the following information to calculate the
Q128: In mountain streams that are steep with
Q129: Which of the following is unlikely to
Q131: Bedrock and sediment in a stream is
Q132: How did the entrenched meanders shown in
Q133: The lowest level to which a stream
Q134: The amount of water flowing through a
Q135: Which site along this stream would have