Multiple Choice
Solve the problem.
-The bar graph below shows a company's yearly profits from 1991 to 1999. Let an represent the company's profit, in millions, in year n, where n=1 corresponds to 1991, n = 2 corresponds to 1992, and so on. 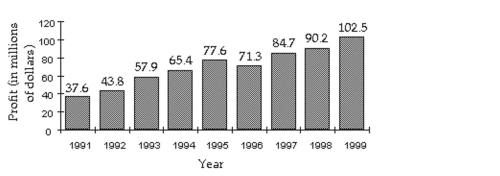
Find
A) million
B) million
C) million
D) million
Correct Answer:

Verified
Correct Answer:
Verified
Q123: Write Terms of an Arithmetic Sequence<br>-
Q124: Use Factorial Notation<br>Write the first four
Q125: Use the Formula for the Sum
Q126: Use Factorial Notation<br>Write the first four
Q127: Evaluate a Binomial Coefficient<br>- <span class="ql-formula"
Q129: Find a Particular Term in a
Q130: Use Summation Notation<br>- <span class="ql-formula" data-value="\frac
Q131: Write Terms of an Arithmetic Sequence<br>-a1 =
Q132: Solve the problem.<br>-A church has 8 bells
Q133: Use Summation Notation<br>- <span class="ql-formula" data-value="3