Multiple Choice
The figure shows the graphs of the cost and revenue functions for a company that manufactures and sells
binoculars. Use the information in the figure to answer the question.
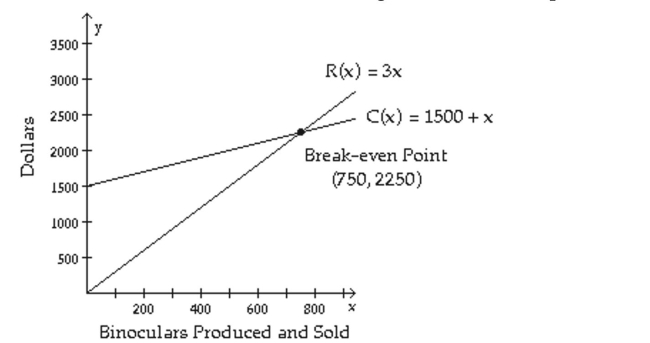
-At the break-even point both cost and revenue are what?
A) $2250
B) $750
C) $1500
D) $2700
Correct Answer:

Verified
Correct Answer:
Verified
Q122: Solve Nonlinear Systems By Addition<br>Solve the
Q123: Solve the problem.<br>-Two cars leave a city
Q124: Solve the system by the substitution
Q125: Decompose P/Q, Where Q Has Repeated
Q126: Solve Nonlinear Systems By Addition<br>Solve the
Q128: Solve the problem.<br>-Two kinds of crated cargo,
Q129: Graph the solution set of the system
Q130: Solve the problem.<br>-The sum of two numbers
Q131: Solve the system by the substitution
Q132: Solve the problem.<br>-One number is 2 less