Multiple Choice
The graph below shows the percentage of students enrolled in the College of Engineering at State University. Use
the graph to answer the question. 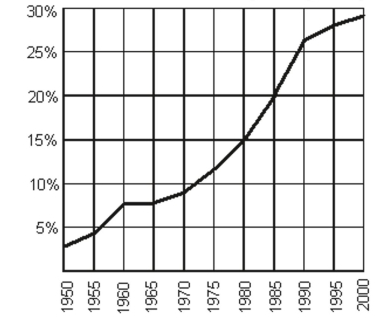
-
A) domain:
range:
B) domain:
range:
C) domain:
range:
D) domain:
range:
Correct Answer:

Verified
Correct Answer:
Verified
Q40: Graph Functions by Plotting Points<br>Graph the
Q41: Use the Vertical Line Test to Identify
Q42: Determine whether the equation defines y
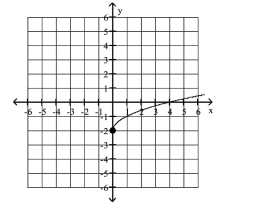
Q43: Give the domain and range of the
Q44: The graph below shows the percentage
Q46: Identify the intercepts.<br>-<img src="https://d2lvgg3v3hfg70.cloudfront.net/TB1195/.jpg" alt=" Identify
Q47: Determine whether the relation is a function.<br>-{(-6,
Q48: Evaluate a Function<br>Evaluate the function at
Q49: Identify the intercepts.<br>-<img src="https://d2lvgg3v3hfg70.cloudfront.net/TB1195/.jpg" alt=" Identify
Q50: Use the Vertical Line Test to Identify