Multiple Choice
Interpret Information Given by Graphs
The line graph shows the recorded hourly temperatures in degrees Fahrenheit at an airport.
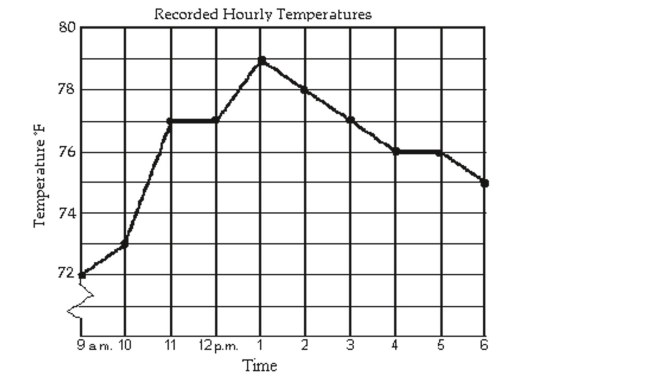
-At what time was the temperature the highest?
A) 1 p.m.
B) 5 p.m.
C) 11 a.m.
D) 2 p.m.
Correct Answer:

Verified
Correct Answer:
Verified
Q253: Solve Radical Equations<br>Solve the radical equation,
Q254: Solve Quadratic Equations by Completing the
Q255: Solve the equation by completing the
Q256: Find Intersections and Unions of Intervals<br>Use
Q257: Solve Absolute Value Inequalities<br>Solve the absolute
Q259: Solve the problem.<br>-The formula <span
Q260: Solve the problem.<br>-A landscaping company sells
Q261: Solve Linear Inequalities<br>Solve the linear inequality.
Q262: Solve Radical Equations<br>Solve the radical equation,
Q263: Recognize Inequalities with No Solution or