Multiple Choice
Interpret Information Given by Graphs
The line graph shows the recorded hourly temperatures in degrees Fahrenheit at an airport.
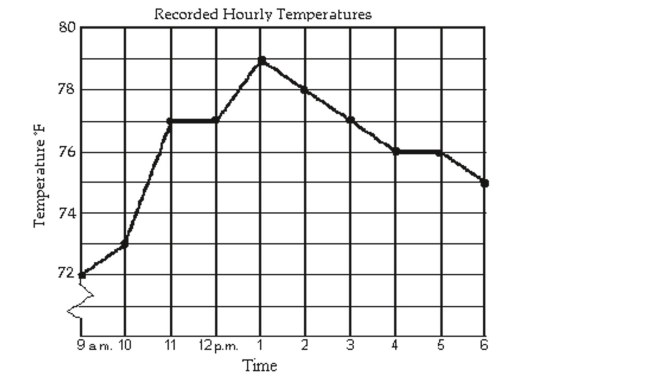
-At what time was the temperature its lowest?
A) 9 a.m.
B) 6 p.m.
C) 4 p.m.
D) 1 p.m.
Correct Answer:

Verified
Correct Answer:
Verified
Q22: Solve Compound Inequalities<br>Solve the compound inequality.
Q23: Solve Linear Inequalities<br>Solve the linear inequality.
Q24: Solve the problem.<br>-Using data from 1996-1998, the
Q25: Perform Operations with Square Roots of
Q26: Solve Equations That Are Quadratic in
Q28: Solve the problem.<br>-A square sheet of
Q29: Use Interval Notation<br>Express the interval in
Q30: Determine the Most Efficient Method to
Q31: Use Interval Notation<br>Express the interval in
Q32: Determine the Most Efficient Method to