Multiple Choice
Interpret Information Given by Graphs
The line graph shows the recorded hourly temperatures in degrees Fahrenheit at an airport.
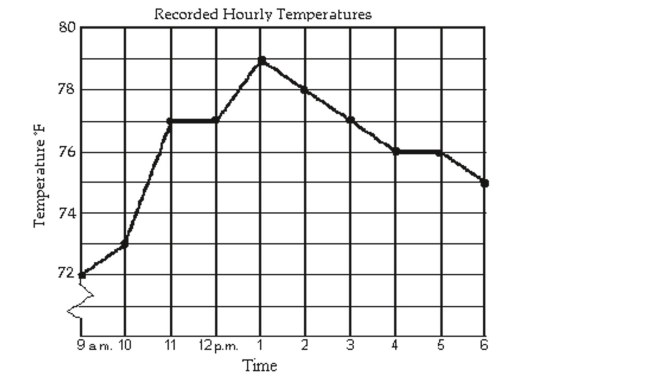
-During which hour did the temperature increase the most?
A) 10 a.m. to 11 a.m.
B) 1 p.m. to 2 p.m.
C) 12 p.m. to 1 p.m.
D) 9 a.m. to 10 a.m.
Correct Answer:

Verified
Correct Answer:
Verified
Q69: Recognize Inequalities with No Solution or
Q70: Solve Equations Involving Absolute Value<br>Solve the
Q71: Solve Absolute Value Inequalities<br>Solve the absolute
Q72: Solve the equation.<br>- <span class="ql-formula" data-value="\frac
Q73: Solve Linear Inequalities<br>Solve the linear inequality.
Q75: Solve the problem.<br>-Sergio's internet provider charges its
Q76: Divide Complex Numbers<br>Divide and express the
Q77: Graph the equation.<br>- <span class="ql-formula" data-value="y
Q78: Solve the equation by factoring.<br>- <span
Q79: Find the product and write the