Multiple Choice
Interpret Information Given by Graphs
The line graph shows the recorded hourly temperatures in degrees Fahrenheit at an airport.
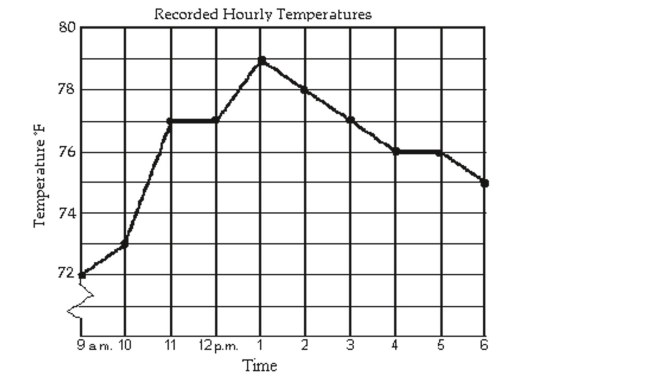
-At what time was the temperature 79°?
A) 1 p.m.
B) 4 p.m.
C) 12 p.m.
D) 3 p.m.
Correct Answer:

Verified
Correct Answer:
Verified
Q13: Solve Quadratic Equations Using the Quadratic
Q14: Find all values of x satisfying
Q15: Solve Equations That Are Quadratic in
Q16: Solve Quadratic Equations by the Square
Q17: Graph the equation.<br>-y = -4 <img src="https://d2lvgg3v3hfg70.cloudfront.net/TB1195/.jpg"
Q19: Perform Operations with Square Roots of
Q20: Recognize Identities, Conditional Equations, and Inconsistent Equations<br>Determine
Q21: Divide Complex Numbers<br>Divide and express the
Q22: Solve Compound Inequalities<br>Solve the compound inequality.
Q23: Solve Linear Inequalities<br>Solve the linear inequality.