Multiple Choice
Interpret Information Given by Graphs
The line graph shows the recorded hourly temperatures in degrees Fahrenheit at an airport.
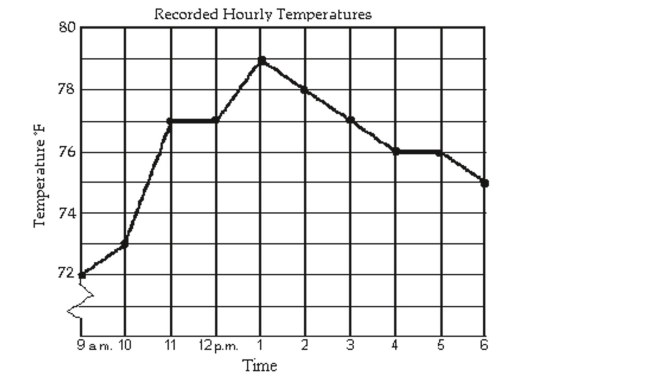
-During which two hour period did the temperature increase the most?
A) 9 a.m. to 11 a.m.
B) 10 a.m. to 11 a.m.
C) 12 p.m. to 2 p.m.
D) 10 a.m. to 12 p.m.
Correct Answer:

Verified
Correct Answer:
Verified
Q144: Solve the formula for the specified
Q145: Find all values of x satisfying
Q146: Find all values of x satisfying
Q147: Solve the problem.<br>-You inherit $10,000 with the
Q148: Solve the formula for the specified
Q150: Solve Quadratic Equations by the Square
Q151: Solve Equations That Are Quadratic in
Q152: Solve the problem.<br>-Greg is opening a car
Q153: Solve the polynomial equation by factoring
Q154: Solve Absolute Value Inequalities<br>Solve the absolute