Multiple Choice
Characterize the relationship shown in the figure. 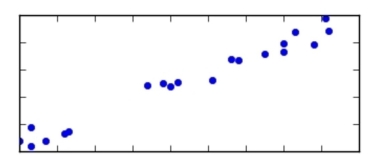
A) positive linear
B) positive nonlinear
C) negative nonlinear
D) negative linear
Correct Answer:

Verified
Correct Answer:
Verified
Related Questions
Q23: The common cricket can be used
Q24: One of the primary feeds for
Q25: The common cricket can be used
Q26: One of the primary feeds for
Q27: Compute the correlation coefficient. <span
Q28: One of the primary feeds for
Q30: MINITAB-style residual plots are shown below. Which
Q31: One of the primary feeds for
Q32: For the following data set, how
Q33: The following table presents the number