Multiple Choice
The following tables present the number of specimens that tested positive for Type A and Type B influenza in the United States during the first 15 weeks of a recent flu season. 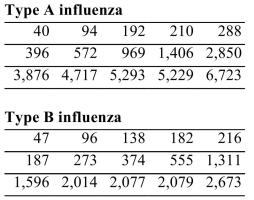
Find the mean number of type A and type B cases in the first 15 weeks of the flu season.
A) Type A: 2,190
Type B: 921
B) Type A: 1,095
Type B: 461
C) Type A: 1,556
Type B: 1,556
D) Type A: 969
Type B: 374
Correct Answer:

Verified
Correct Answer:
Verified
Q17: For the data set below, find
Q18: For the data set below, find
Q19: For the data shown in the histogram,
Q20: For the data set below, find
Q21: Following are heights, in inches, for
Q23: A survey found that the median number
Q24: For the data set below, find
Q25: Approximate the population standard deviation given
Q26: A data set has a median of
Q27: Find the median for the following data