Multiple Choice
The following tables present the number of specimens that tested positive for Type A and Type B influenza in the United States during the first 15 weeks of a recent flu season. 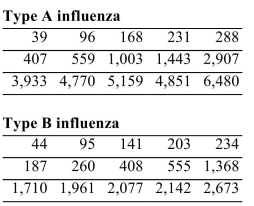
Find the median number of type A and type B cases in the first 15 weeks of the flu season.
A) Type A: 1,078
Type B: 469
B) Type A: 1,003
Type B: 408
C) Type A: 1,546
Type B: 1,546
D) Type A: 2,156
Type B: 937
Correct Answer:

Verified
Correct Answer:
Verified
Q66: The table below lists the populations,
Q67: In Steve's statistics class, the final grade
Q68: Approximate the population variance given the
Q69: Find the median for the following
Q70: Find the mean for the following data
Q72: For the data set below, find
Q73: A soft-drink bottling company fills and
Q74: Find the mean for the following
Q75: Use the given frequency distribution to
Q76: Construct a boxplot for the data