Multiple Choice
The following MINITAB output display presents the results of a hypothesis test for the difference between two population means. 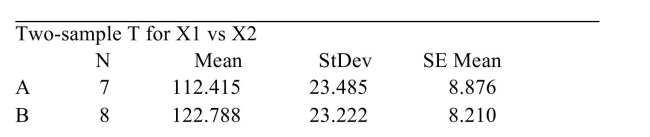 Difference
Estimate for difference:
CI for difference:
Test of difference vs not T-Value
How many degrees of freedom are there for the test statistic?
A) 10.373
B) 12
C) 1.593507
D) 13
Correct Answer:

Verified
Correct Answer:
Verified
Q16: In an experiment to determine whether
Q17: An <span class="ql-formula" data-value="F"><span class="katex"><span
Q18: An amateur golfer wishes to determine
Q19: Are low-fat diets or low-carb diets
Q20: A test was made of
Q22: A sociologist studies a sample of
Q23: The following display from a TI-84
Q24: A garden seed wholesaler wishes to
Q25: Five null hypotheses were tested, and
Q26: Following is a sample of five