Multiple Choice
The following MINITAB output display presents a 95% confidence interval for the difference between two means. 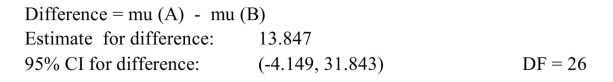
How many degrees of freedom did MINITAB use?
A) 26
B) 13.847
C) 28
D) 35.992
Correct Answer:

Verified
Correct Answer:
Verified
Related Questions
Q8: A group of six individuals with
Q9: A survey of college students reported that
Q10: Using technology, solve the following problem: In
Q11: A sample of students is enrolled in
Q12: An amateur golfer wishes to determine if
Q14: The following display from a TI-84
Q15: The following display from a TI-84 Plus
Q16: Construct the confidence interval for the
Q17: In a random sample of 70 patients
Q18: The following display from a TI-84 Plus