Multiple Choice
A function shows constant percentage growth. Which of the following may be the graph of this function?
A) 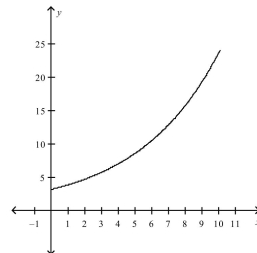
B) 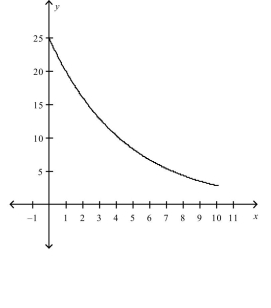
C) 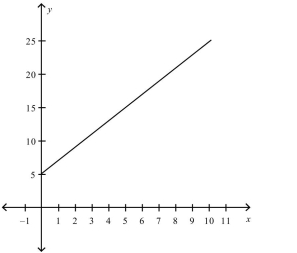
D) 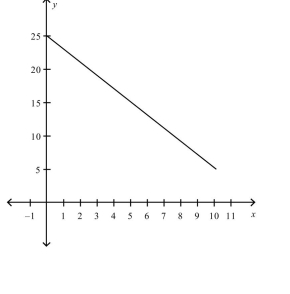
Correct Answer:

Verified
Correct Answer:
Verified
Related Questions
Q66: Use exponential regression to determine what
Q67: The decay factor of an exponential
Q68: The size N , in thousands,
Q69: Find an exponential model for the
Q70: If a function decreases by 5% each
Q72: The magnitude of earthquake 1 is 3.6,
Q73: Find an exponential model for the
Q74: The magnitude M of an earthquake
Q75: Find an exponential model for the
Q76: Use exponential regression to determine what