Multiple Choice
A function shows constant percentage growth. Which of the following may be the graph of this function?
A) 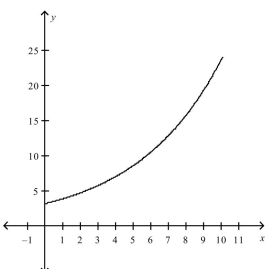
B) 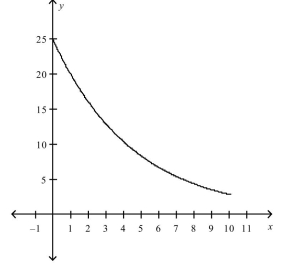
C) 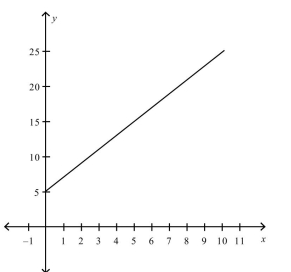
D) 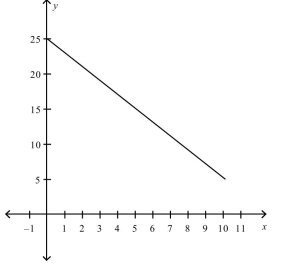
Correct Answer:

Verified
Correct Answer:
Verified
Related Questions
Q10: A radioactive substance is decaying exponentially with
Q70: If a function decreases by 5% each
Q83: Use exponential regression to determine what
Q84: The size N , in thousands,
Q87: Use exponential regression to determine what
Q89: The formula for an exponential function
Q90: Use exponential regression to determine what
Q91: <span class="ql-formula" data-value="\text { If } \log
Q92: Use exponential regression to determine what
Q93: The monthly percentage decay rate for a