Multiple Choice
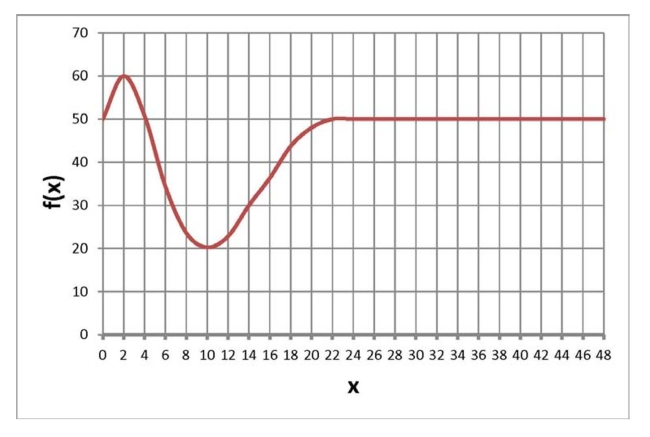
Below is a graph of a function . Find the average rate of change in from 10 to 12 . 
A) 30
B) 2.5
C) 10
D) None of the above
Correct Answer:

Verified
Correct Answer:
Verified
Related Questions
Q14: Choose the answer that best completes the
Q81: The following table shows average rice
Q82: <span class="ql-formula" data-value="\text { If } k
Q83: <img src="https://d2lvgg3v3hfg70.cloudfront.net/TB3388/.jpg" alt=" A) 3.47
Q84: Below is a graph of a
Q87: The following table shows the U.S.
Q88: Below is a graph of a
Q89: <span class="ql-formula" data-value="\text { If } g
Q90: The following table shows the U.S.
Q91: <span class="ql-formula" data-value="\text { If } f