Multiple Choice
Find the area of the shaded region. The graph depicts the standard normal distribution with mean 0 and standard deviation 1. 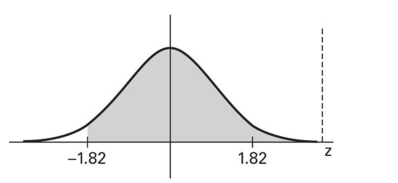
A) 0.0344
B) 0.4656
C) -0.0344
D) 0.9656
Correct Answer:

Verified
Correct Answer:
Verified
Related Questions
Q207: Solve the problem.<br>-Samples of size n =
Q208: Solve the problem.<br>-In one region, the September
Q209: The heights of adult females are normally
Q210: What is the probability that the random
Q211: The normal distribution has a greater percentage
Q213: Find the probability that in 200 tosses
Q214: Solve the problem.<br>-The amount of rainfall
Q215: Solve the problem.<br>-Assume that z scores
Q216: Which of the following is a biased
Q217: The Precision Scientific Instrument Company manufactures