Multiple Choice
Find the area of the shaded region. The graph depicts the standard normal distribution with mean 0 and standard deviation 1. 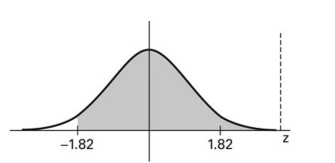
A) 0.4656
B) 0.0344
C) -0.0344
D) 0.9656
Correct Answer:

Verified
Correct Answer:
Verified
Related Questions
Q20: In a population of 210 women,
Q21: If z is a standard normal variable,
Q22: Find the area of the shaded region.
Q23: Solve the problem.<br>-A poll of 1200 randomly
Q24: Solve the problem.<br>-For women aged 18-24, systolic
Q26: If z is a standard normal variable,
Q27: Estimate the indicated probability by using the
Q29: Solve the problem.<br>-Three randomly selected households are
Q30: Solve the problem. Round to the nearest
Q38: If a histogram of a sample of