Multiple Choice
Find the area of the shaded region. The graph depicts the standard normal distribution with mean 0 and standard
deviation 1.
-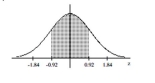
A) 0.6424
B) 0.3576
C) 0.8212
D) 0.1788
Correct Answer:

Verified
Correct Answer:
Verified
Related Questions
Q1: Solve the problem.<br>-The number of books sold
Q2: Solve the problem. Round to the nearest
Q3: The Precision Scientific Instrument Company manufactures
Q4: Solve the problem.<br>-In a certain population, 10%
Q6: Use the normal distribution to approximate the
Q7: Find the indicated z score. The graph
Q8: If z is a standard normal variable,
Q9: Solve the problem.<br>-Three randomly selected households are
Q10: Assume that X has a normal
Q11: Assume that the weight loss for