Multiple Choice
Find the indicated z score. The graph depicts the standard normal distribution with mean 0 and standard deviation 1.
-Shaded area is 0.8599. 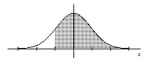
A) 0.8051
B) 1.08
C) 0.5557
D) -1.08
Correct Answer:

Verified
Correct Answer:
Verified
Related Questions
Q129: The Precision Scientific Instrument Company manufactures
Q130: Assume that the red blood cell counts
Q131: Find the indicated z score. The graph
Q132: Assume that X has a normal
Q133: The Precision Scientific Instrument Company manufactures
Q135: For the binomial distribution with the given
Q136: Solve the problem.<br>-A recent survey based on
Q137: Solve the problem.<br>-After constructing a new manufacturing
Q138: Solve the problem.<br>-The ages (in years) of
Q139: What is the probability that the random