Essay
Solve the problem.
-A normal quartile plot is given below for the weekly incomes (in dollars) of a sample of engineers in one town.
Use the plot to assess the normality of the incomes of engineers in this town. Explain your reasoning. 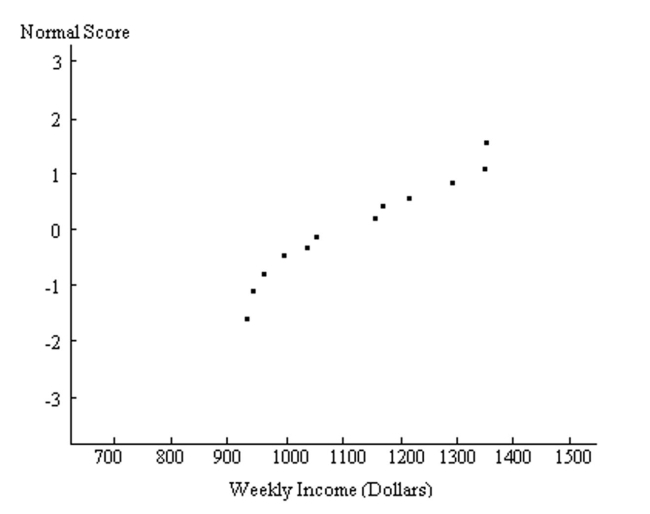
Correct Answer:

Verified
Since the normal quartile plot displays ...View Answer
Unlock this answer now
Get Access to more Verified Answers free of charge
Correct Answer:
Verified
View Answer
Unlock this answer now
Get Access to more Verified Answers free of charge
Q93: Solve the problem.<br>-When sampling without replacement
Q94: Solve the problem.<br>-Flood insurance policies sold in
Q95: Solve the problem.<br>-For a standard normal distribution,
Q96: Estimate the indicated probability by using the
Q97: Solve the problem.<br>-The probability of exactly 44
Q99: An unbiased estimator is a statistic that
Q100: Solve the problem.<br>-The scores on a certain
Q101: The Precision Scientific Instrument Company manufactures
Q102: Use the normal distribution to approximate the
Q163: Solve the problem.<br>-A final exam in Math