Multiple Choice
Construct a boxplot for the given data. Include values of the 5-number summary in all boxplots.
-The test scores of 32 students are listed below. Construct a boxplot for the data set.
A) 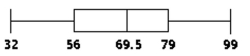
B) 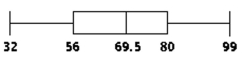
C) 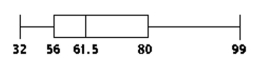
D) 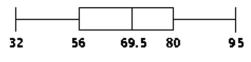
Correct Answer:

Verified
Correct Answer:
Verified
Related Questions
Q11: Which do you think has less variation:
Q151: Solve the problem.<br>-A student earned grades of
Q152: Find the midrange for the given
Q154: Find the median for the given
Q155: Find the standard deviation for the
Q157: The local Tupperware dealers earned these
Q158: Find the midrange for the given
Q159: Find the percentile for the data
Q160: The following are interval times (minutes)
Q161: Solve the problem.<br>-Skewness can be measured