Multiple Choice
Construct a boxplot for the given data. Include values of the 5-number summary in all boxplots.
-The normal monthly precipitation (in inches) for August is listed for 20 different U.S. cities. Construct a boxplot for the data set.
A) 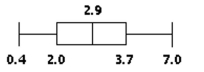
B) 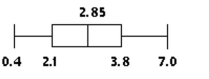
C) 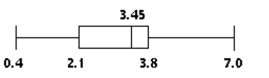
D) 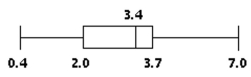
Correct Answer:

Verified
Correct Answer:
Verified
Related Questions
Q181: Use the range rule of thumb
Q182: Find the variance for the given
Q183: Find the number of standard deviations from
Q184: Find the mode(s) for the given
Q185: Find the midrange for the given
Q187: Find the mode(s) for the given
Q188: Find the z-score corresponding to the given
Q189: Human body temperatures have a mean
Q190: Solve the problem. Round results to the
Q191: Solve the problem. Round results to the