Multiple Choice
The following data represent the number of cars passing through a toll booth during a certain time period over a number of days. 
38 39 37 37 44 38 41 38 39 35 42 39 43 37 41
A) 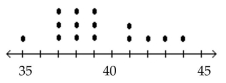
B) 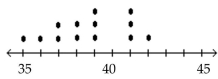
C) 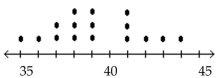
D) 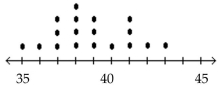
Correct Answer:

Verified
Correct Answer:
Verified
Related Questions
Q50: Explain in your own words why a
Q55: The weights (in pounds) of 22
Q56: A nurse measured the blood pressure of
Q57: A school district performed a study
Q58: A store manager counts the number of
Q60: A manufacturer records the number of
Q61: Identify the cumulative frequency distribution that
Q62: The frequency distribution below summarizes employee
Q63: The scores on a recent statistics
Q64: The following frequency distribution analyzes the