Essay
Construct a pie chart representing the given data set.
-A parcel delivery service lowered its prices and finds that it has delivered twice as many parcels this year as it
did last year. To illustrate this fact, the manager draws a graph as shown below. Each cube depicts a parcel. The
side length of the "parcel" on the right is twice the side length of the "parcel" on the left. Why is this graph
misleading? What visual impression is created by the graph? 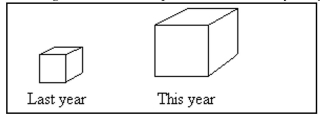
Correct Answer:

Verified
The volume of the cube on the right is e...View Answer
Unlock this answer now
Get Access to more Verified Answers free of charge
Correct Answer:
Verified
View Answer
Unlock this answer now
Get Access to more Verified Answers free of charge
Q110: The frequency distribution below summarizes employee
Q111: The following frequency distribution analyzes the
Q112: A nurse measured the blood pressure of
Q113: Which of the following cumulative frequency
Q114: On a math test, the scores
Q116: The following data show the number
Q117: The following frequency distribution represents the
Q118: Smoking and the episodes of lung cancer
Q119: The scatterplot below displays the amount
Q120: A nurse measured the blood pressure of