Essay
Examine the given run chart or control chart and determine whether the process is within statistical control. If it
is not, identity which of the three out-of-statistical-control criteria apply. A run chart for individual values W is
shown below. Does there appear to be a pattern suggesting that the process is not within statistical control? If
so, describe the pattern. 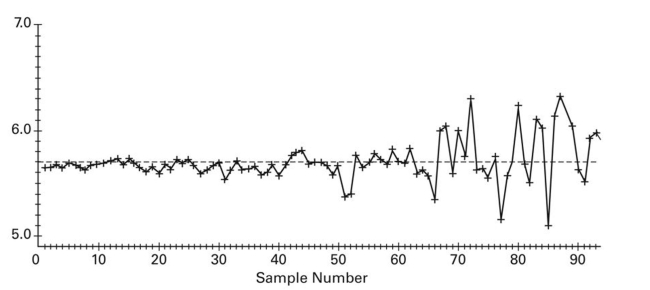
Correct Answer:

Verified
The process appears ...View Answer
Unlock this answer now
Get Access to more Verified Answers free of charge
Correct Answer:
Verified
View Answer
Unlock this answer now
Get Access to more Verified Answers free of charge
Q11: Solve the Problem.<br>-A control chart for attributes
Q16: A control chart for <span
Q17: A control chart for R is shown
Q18: A run chart for individual values is
Q19: An x chart based on standard
Q20: A machine is supposed to fill boxes
Q22: Which type of chart would be
Q23: Match the chart with its characteristic.
Q24: Which graph using individual data values
Q25: <img src="https://d2lvgg3v3hfg70.cloudfront.net/TB7898/.jpg" alt=" " class="answers-bank-image d-block" rel="preload"