Essay
A control chart for R is shown below. Determine whether the process variation is within statistical control. If it
is not, identify which of the three out-of-control criteria lead to rejection of statistically stable variation. 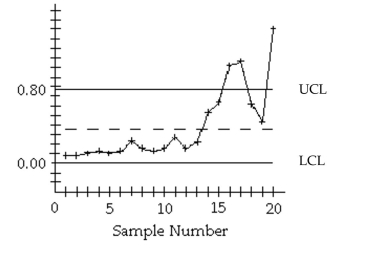
Correct Answer:

Verified
Process variation appears to be out of s...View Answer
Unlock this answer now
Get Access to more Verified Answers free of charge
Correct Answer:
Verified
View Answer
Unlock this answer now
Get Access to more Verified Answers free of charge
Q35: Sketch a run chart that that indicates
Q37: Provide an appropriate response. Describe what process
Q80: A machine that is supposed to produce
Q81: The centerline for a control chart for
Q82: A machine that is supposed to produce
Q83: A control chart for <span
Q87: A manufacturer monitors the level of
Q88: Examine the given run chart or control
Q89: Use the given process data to
Q90: Examine the given run chart or control