Multiple Choice
The following scatterplot shows the percentage of the vote a candidate received in the 2004 senatorial elections according to the voter's income level based on an exit poll of voters conducted by CNN. The income levels 1-8 correspond to the following income classes: 1=Under $15,000; 2=$15-30,000; 3=$30-50,000; 4=$50-75,000; 5=$75-100,000; 6=$100-150,000;
7=$150-200,000; 8=$200,000 or more. 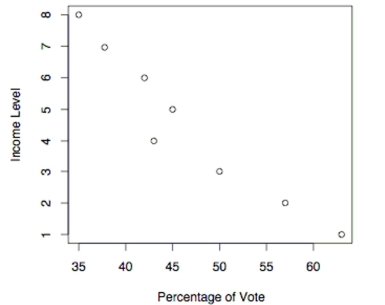
-Use the election scatterplot to the find the value of the rank correlation coefficient
A)
B)
C)
D)
Correct Answer:

Verified
Correct Answer:
Verified
Q2: Explain what an efficiency rating is. You
Q6: Use the runs test to determine
Q7: Use Wilcoxon's signed-ranks test and a
Q8: Use the Wilcoxon signed -ranks test
Q10: Use a Kruskal-Wallis test to test
Q12: Use the rank correlation coefficient to
Q13: Use a Kruskal-Wallis test to test
Q14: Use the sign test to test
Q15: Match the parametric test with its comparable
Q16: A teacher uses two different CAI