Multiple Choice
The following scatterplot shows the percentage of the vote a candidate received in the 2004 senatorial elections according to the voter's income level based on an exit poll of voters conducted by CNN. The income levels 1-8 correspond to the following income classes: 1=Under $15,000; 2=$15-30,000; 3=$30-50,000; 4=$50-75,000; 5=$75-100,000; 6=$100-150,000;
7=$150-200,000; 8=$200,000 or more. 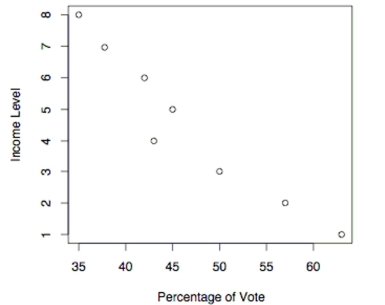
-Use the election scatterplot to the find the critical values corresponding to a 0.01 significance level used to test the null hypothesis of
A) -0.738 and 0.738
B) 0.881
C) -0.881
D) -0.881 and 0.881
Correct Answer:

Verified
Correct Answer:
Verified
Q94: Find the critical value. Assume that
Q95: Find the critical value. Assume that
Q96: A true-false test had the following answer
Q97: The heights of 16 randomly selected
Q98: Match the nonparametric test with its related
Q100: A researcher wishes to study whether music
Q101: A standard aptitude test is given
Q102: In a study of the effectiveness
Q103: Suppose that a Kruskal-Wallis Test is to
Q104: When performing a rank correlation test,