Multiple Choice
Construct a scatterplot for the given data.
A) 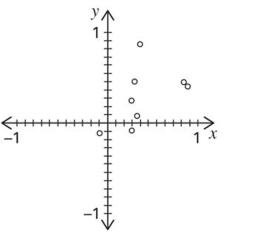
B) 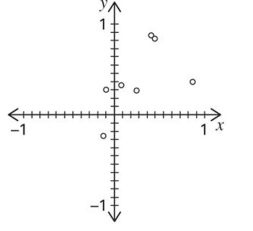
C) 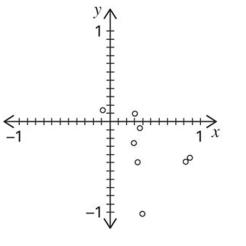
Correct Answer:

Verified
Correct Answer:
Verified
Related Questions
Q6: Applicants for a particular job, which
Q7: Given the linear correlation coefficient r
Q8: Suppose you will perform a test
Q9: Use the given data to find
Q10: Find the unexplained variation for the
Q12: Use the given data to find
Q13: Suppose you will perform a test
Q14: Use computer software to find the
Q15: Use computer software to obtain the
Q45: Sketch a sample scatterplot of at least