Multiple Choice
Use the computer display to answer the question.
-A collection of paired data consists of the number of years that students have studied Spanish and their scores on a Spanish language proficiency test. A computer program was used to obtain the least squares linear
Regression line and the computer output is shown below. Along with the paired sample data, the program was
Also given an x value of 2 (years of study) to be used for predicting test score.
The regression equation is 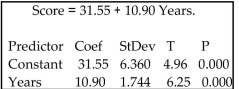
Predicted values
Use the information in the display to find the value of the linear correlation coefficient r. Determine whether
There is significant linear correlation between years of study and test scores. Use a significance level of 0.05.
There are 10 pairs of data.
A) r = 0.83; There is no significant linear correlation.
B) r = 0.91; There is no significant linear correlation
C) r = 0.91; There is significant linear correlation.
D) r = 0.83; There is significant linear correlation.
Correct Answer:

Verified
Correct Answer:
Verified
Q88: Find the indicated multiple regression equation.
Q89: Determine which scatterplot shows the strongest linear
Q90: Construct a scatterplot and identify the
Q91: Find the value of the linear
Q92: Find the explained variation for the
Q94: Given the linear correlation coefficient r
Q95: Find the unexplained variation for the
Q96: Determine which plot shows the strongest linear
Q97: Is the data point, P, an
Q98: Is the data point, P, an outlier,