Multiple Choice
Selling price and amount spent advertising were entered into a multiple regression to determine what affects flat panel LCD TV sales. The plot of residuals versus Predicted values is shown below. What does the residual plot suggest? 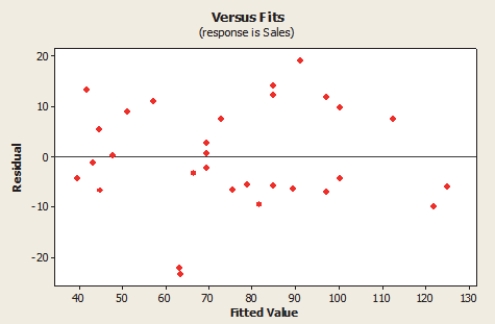
A) The Linearity condition is not satisfied.
B) There is an extreme departure from normality.
C) The variance is not constant.
D) The presence of a couple of outliers.
E) The plot thickens from left to right.5.5 Calculate and interpret the adjusted R2.
Correct Answer:

Verified
Correct Answer:
Verified
Q18: A sample of 33 companies was
Q19: Use the following information for problems
Q20: Selling price and amount spent advertising
Q21: Use the following information for problems
Q22: A sample of 33 companies was randomly
Q24: A sample of 33 companies was
Q25: A sample of 33 companies was
Q26: Use the following information for problems
Q27: Use the output to describe the relationship
Q28: A sample of 33 companies was