Essay
Use the following for questions
A sales manager was interested in determining if there is a relationship between college GPA and sales performance among salespeople hired within the last year. A sample of recently hired salespeople was selected and college GPA and the number of units sold last month recorded. Below are the scatterplot, regression results, and residual plots for these data. The regression equation is
Units Sold GPA
Analysis of Variance
Answer: 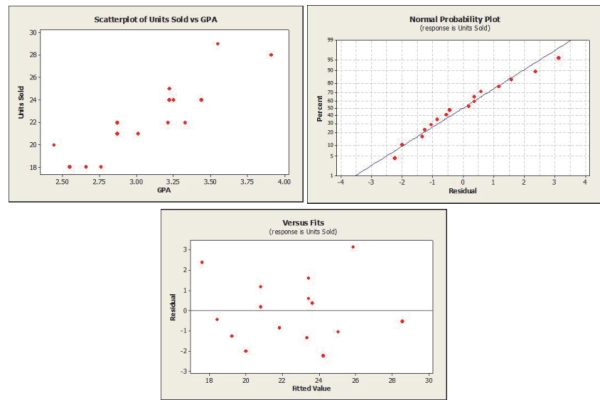
-Circle the standard error of the slope and its components in the output shown. If the
information is not in the output, list components.
Correct Answer:

Verified
[standard error of the slope,  , and stan...
View Answer
Unlock this answer now
Get Access to more Verified Answers free of charge
Correct Answer:
Verified
View Answer
Unlock this answer now
Get Access to more Verified Answers free of charge
Q5: A researcher is interested in developing a
Q6: In a significant regression model determining if
Q7: A researcher gathers data on the length
Q8: Use the following for questions <br>A
Q9: Use the following information for questions <br>Nutritional
Q11: Which of the following does NOT affect
Q12: Use the following information for questions <br>Nutritional
Q13: Use the following for questions <br>An
Q14: Cars from an online service were examined
Q15: As the carbon content in steel