Multiple Choice
After the financial crisis of 2007/2008, the Dow Jones Industrial Average (DJIA) improved from a low of 7278 on March 20, 2009, to new records just a few years later.
On August 8, 2011, the Dow dropped 634.8 points. A histogram of day-to-day changes in
The DJIA looked like the histogram below. An accurate description of the distribution of
Changes in the DJIA is 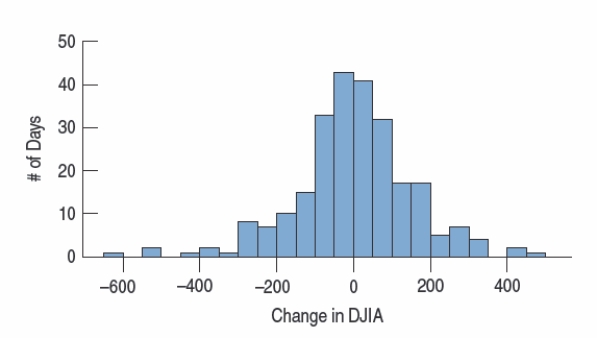
A) The distribution is fairly symmetric.
B) The distribution is somewhat left skewed with a number of low outliers.
C) A normal probability plot would add information about the normality of the data
Set)
D) Both A and C
E) Both B and C
Correct Answer:

Verified
Correct Answer:
Verified
Q1: In a metal fabrication process, metal rods
Q20: A survey of investors finds that 60%
Q21: One division of a large defense contractor
Q23: Assume that a set of test scores
Q24: Suppose the time it takes for a
Q26: All else being equal, decreasing the level
Q27: EU (European Union) countries report that 46%
Q28: Which is true about a 90% confidence
Q29: In a recent poll of 200 households,
Q30: A government agency has 6000 employees.